Acoustic Analysis
- Oct 17, 2020
- 3 min read
Updated: Sep 1, 2023
Location: Cambridge, MA
Date: Fall 2019
The class 2.671, Measurement and Instrumentation, tasked me in creating a technical research project from inception to validation. Because I recently had learned to play the ukulele, I decided to use this opportunity to understand why the online ukulele community recommended strumming where the body met the neck, AKA "the sweet spot". I learned fundamentals of signal processing, uncertainty, and structured technical communication.
What I Learned:
how to engage in a research & poster presentation
how to make information accessible for varying degrees of familiarity with the subject
how to design visuals to express technical information
the importance of calculating uncertainty & engaging critically with data
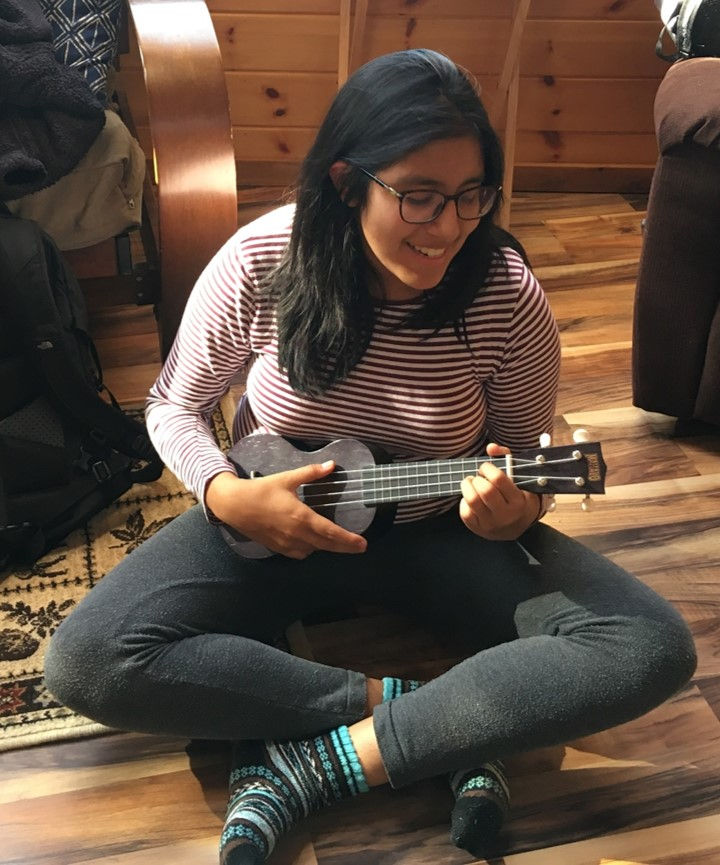
As I mentioned, I had been trying for a while to understand where along the ukulele I could obtain "best" sound. I decided to dedicate my research project to the understanding of this - leading me down a path of understanding timbre, signal processing, fourier transforms, and ultimately the spectrum of sound that could be found within the palette of a ukulele.
Guided by my professor and a plethora of sensors at my disposal and a curiosity about the science behind a musical object I loved very much, I proceeded to draft some tests around the ukulele.
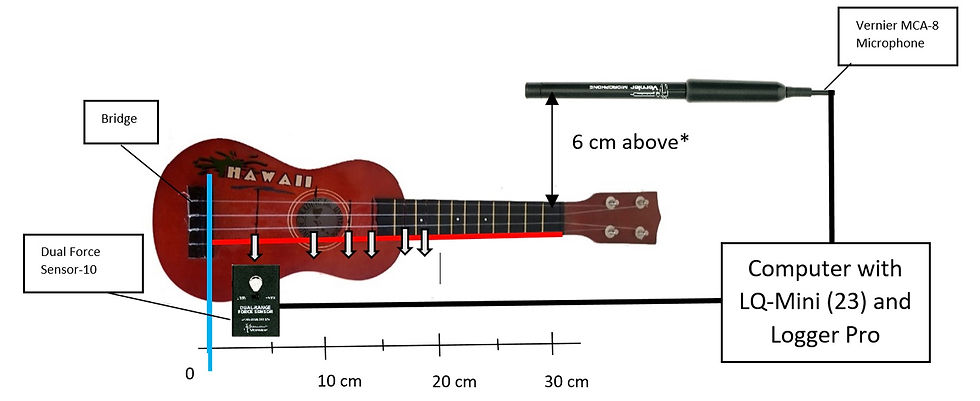
The experimental set-up’s main purpose was to facilitate the collection of sound. The sensors used:
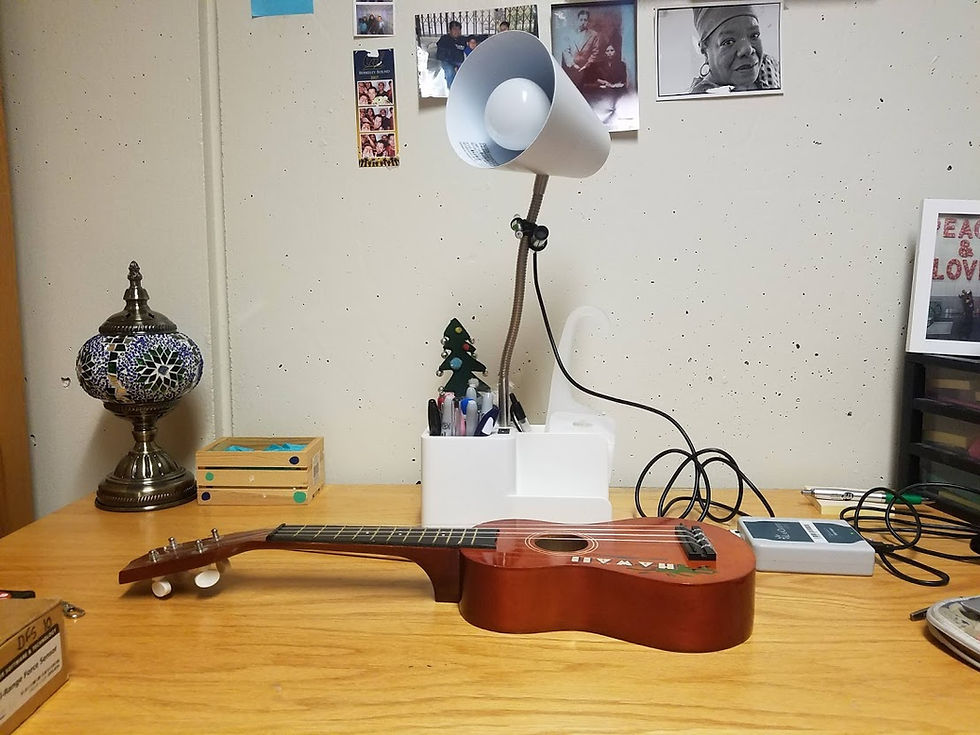
Vernier MCA-8. This microphone, pictured as attached to the “white lamp” in the picture, captured the sound of the ukulele as the DFS plucked it. It was held to the lamp by tape and at an angle of approximately 45 degrees from the table.
Vernier DFS-10. The Dual-Range Force sensor was used to monitor the force used to pull the string during every measurement. To mimic the reality of plucking a string, a screw held a guitar pick inside the DFS as shown:
Vernier LQ-Mini 23: Connected both the DFS and MCA to Logger Pro, software that analyzes input data.
Ukulele: The ukulele was marked at 6 plucking points along the A string (440 Hz fundamental frequency) at given distances the bridge, shown as white arrows in Fig 4.
o 1: 4.0 cm
o 2: 9.2 cm
o 3: 12.5 cm
o 4: 14.6 cm
o 5: 17.7 cm
o 6: 20.0 cm
These values were chosen due to their prevalence as common playing points in the ukulele playing community. Point 1 is located very close to the bridge, its timbre often described as “tight” in contrast to Point 2, which is above the sound hole and described as “round”, “full”, and “loud” sound. The “sweet spot”, a special point in the ukulele-playing community, is found at Point 5, which is the point at which the ukulele’s body meets the neck.
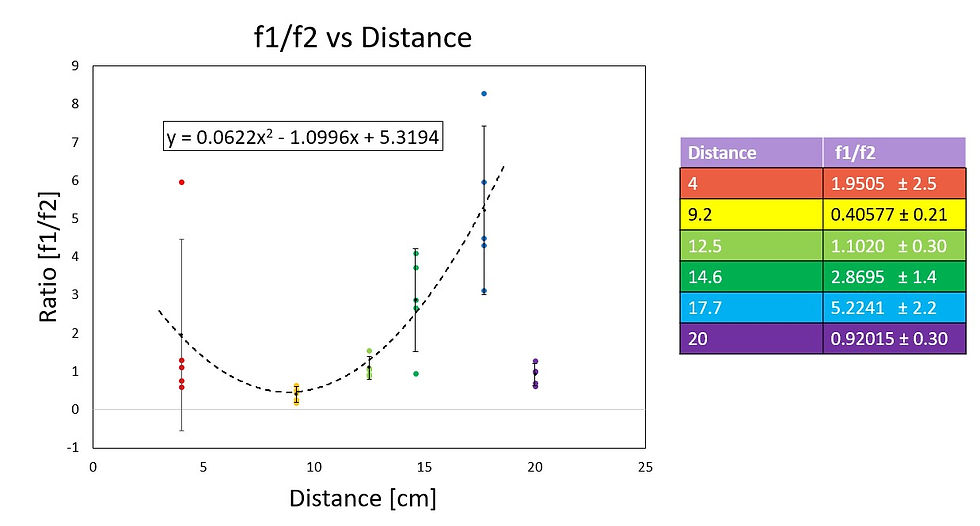
To determine differences in timbre along the body of the ukulele, the main concept analyzed was the intensity of harmonics and their ratios. The fundamental frequency of the A string on an ukulele is 440 Hz [Figure 9], and the second harmonic is about 870 Hz. However, as we can observe in Figure 9, the third, fourth, and fifth harmonic are less than 10% of the intensity of the first and second harmonic. Thus, in this analysis only the first and second harmonic are taken into account to characterize the timbre.

To more accurately understand the intensity of each harmonic, the area of each peak was calculated using integrals, instead of solely relying on the peak’s magnitude. Solely relying on the peak’s magnitude initially led to large uncertainties, due to the MCA Microphone’s limited resolution as well as the DFS’s precision in applying the same force at each pluck.
A parabolic relationship between the ratios of f1 and f2 were found along the ukulele, creating the model for a "spectrum of timbre". The largest ratio is found 17.7 cm from the bridge, where the "sweet spot" is found.
In Summary:
This was my first technical research project! Inspired by my curiosity around ukulele strumming, I created a research project to validate the "sweet" spot along the instrument's body. My results confirmed the existence of the "sweet spot" and produced a spectrum of timbre using the ratio of harmonics at specified locations. I presented my results through a formal presentation, a poster session, and a final paper. The guidance from my professors encouraged me to explore the nuances of my results,
Attached is my final paper, the final deliverable for the class which includes more technical details on the matter.
Comments